addChart

addChart
 BASIC / ADVANCED / PREMIUM
Inserts a chart into the Excel spreadsheet.
This method allows the insertion of a chart into the Excel spreadsheet.
This method also allows adding trendlines, grids, labels and many other chart features.
Chart size is set using rowSize and colSize options. If these values are not set, the chart size is set to 6 columns and 10 rows.
chart
Chart type:
- area
- area3D
- bar
- bar3D, bar3DCone, bar3DCylinder, bar3DPyramid
- bubble
- col
- col3D, col3DCone, col3DCylinder, col3DPyramid
- doughnut
- line
- line3D
- ofPie
- pie
- pie3D
- radar
- scatter
- surface
position
Cell position in the active sheet: A1, C3, AB7...
options
| Key | Type | Description |
|---|---|---|
| data | array | This array contains legends, labels and values of the chart. Individual cell positions and cell range positions can be used. |
| border | int | Border width in points. |
| color | int | Color scheme. |
| colOffset | array |
|
| colSize | int | Number of columns used by the chart. |
| font | string | The font to be used. Arial, Calibri... |
| rowOffset | array |
|
| rowSize | int | Number of rows used by the chart. |
| title | string | The chart title (if any). |
Chart display properties
| Key | Type | Description |
|---|---|---|
| axPos | array | Position of the axis (r, l, t, b). Each value of the array for each position (if a value if null avoids adding it). |
| formatCode | string | Number format. |
| formatDataLabels | array | Possible keys and values are:
|
| haxLabel | string | Label for the horizontal axis. |
| haxLabelDisplay | string | How to display the label of the horizontal axis. Possible values are: vertical, horizontal, rotated. |
| hgrid | int | Horizontal grid. Possible values are:
|
| majorUnit | float | Major unit value for bar, col and line charts. |
| minorUnit | float | Minor unit value for bar, col and line charts. |
| orientation | array | Orientation of the axis, from min to max (minMax) or max to min (maxMin). Each value of the array for each axis (if a value if null avoids adding it). |
| scalingMax | float | Scaling max value for bar, col and line charts. |
| scalingMin | float | Scaling max value for for bar, col and line charts. |
| stylesTitle | array | Possible keys and values are:
|
| tickLblPos | string | Tick label position (nextTo, high, low, none). If string, uses default values. If array, sets a value for each position. |
| vaxLabel | string | Label for the vertical axis. |
| vaxLabelDisplay | string | How to display the label of the horizontal axis. Possible values are: vertical, horizontal, rotated. |
| vgrid | int | Vertical grid. Possible values are:
|
The available parameters to display legends and data include:
| Key | Type | Description |
|---|---|---|
| legendOverlay | bool | If true the legend may overlay the chart. |
| legendPos | string | The possible values are:
|
| showCategory | bool | If true shows the categories inside the chart. |
| showLegendKey | bool | If true shows the legend values. |
| showPercent | bool | If true shows the percentage values. |
| showSeries | bool | If true shows the series values. |
| showTable | bool | If true shows the chart data in an associated table. |
| showValue | bool | If true shows the chart data values. |
| trendline | array | Adds trendlines. Compatible with line, bar, col and area 2D charts. Possible keys and values are:
|
Further configuration options for specific chart types are:
| Key | Type | Description |
|---|---|---|
| Bar and column charts | ||
| gapWidth | int | Gap width. |
| groupBar | string | Different ways to group data. Possible values are: clustered, stacked, percentStacked and standard. |
| overlap | int | Overlap. |
| Pie and doughnut charts | ||
| explosion | int | Distance between the different values. |
| holeSize | int | Size of the inner hole (only doughnut charts). |
| Line charts | ||
| smooth | mixed | If true it smooths the line. '0' forces disabling it |
| symbol | string | The possible symbol values are:
|
| symbolSize | int | The size of the symbol used. From 1 to 73. |
Additional available options for 3D charts:
| Key | Type | Description |
|---|---|---|
| perspective | int | Perspective angle. Angles beyond 25 degrees provoke a big distortion in the 3D chart representation. |
| rotX | int | Rotation angle with respect to the vertical axis. Standard values are between 10 and 20 degrees. |
| rotY | int | Rotation angle with respect to the horizontal axis. Standard values are between 10 and 20 degrees. |
Theme options (Available in Premium licenses):
| Key | Type | Description |
|---|---|---|
| chartArea | array | backgroundColor |
| gridLines | array |
|
| horizontalAxis | array |
|
| legendArea | array |
|
| plotArea | array | backgroundColor |
| serDataLabels | array |
|
| serRgbColors | array | series colors |
| valueDataLabels | array |
|
| valueRgbColors | array | values colors |
| verticalAxis | array |
|
Data array is not set.
Chart type is not supported.
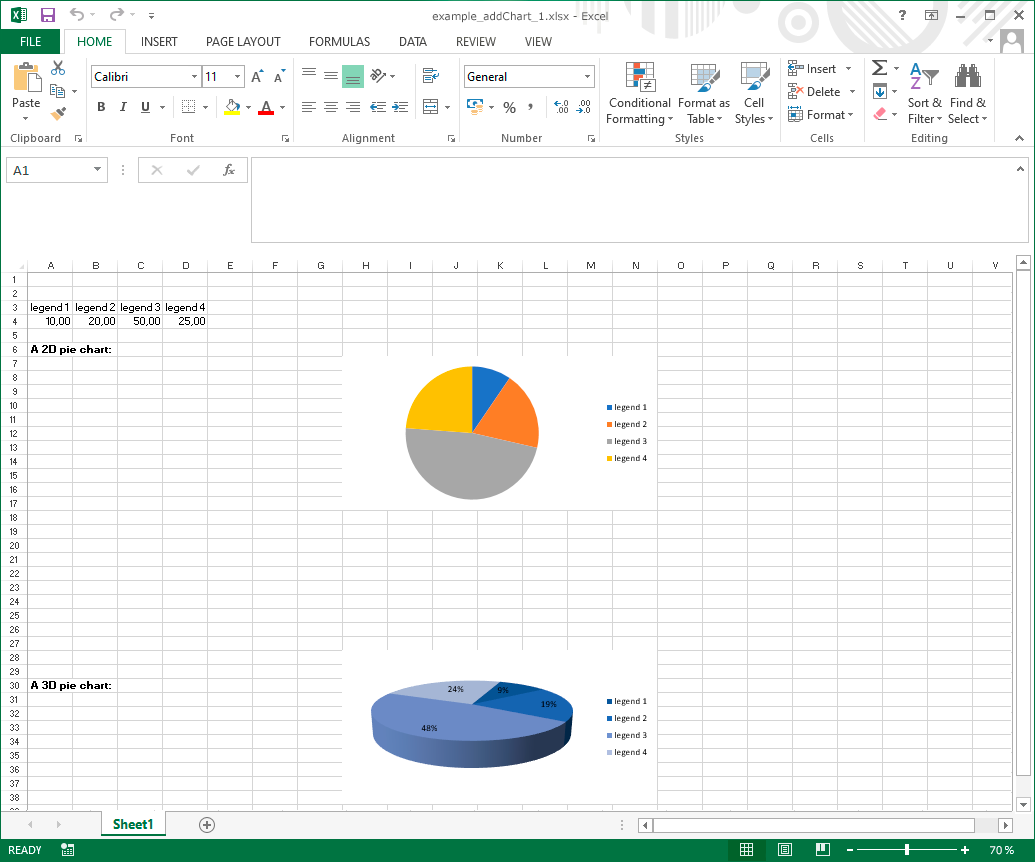
Example #1
The resulting XLSX looks like:
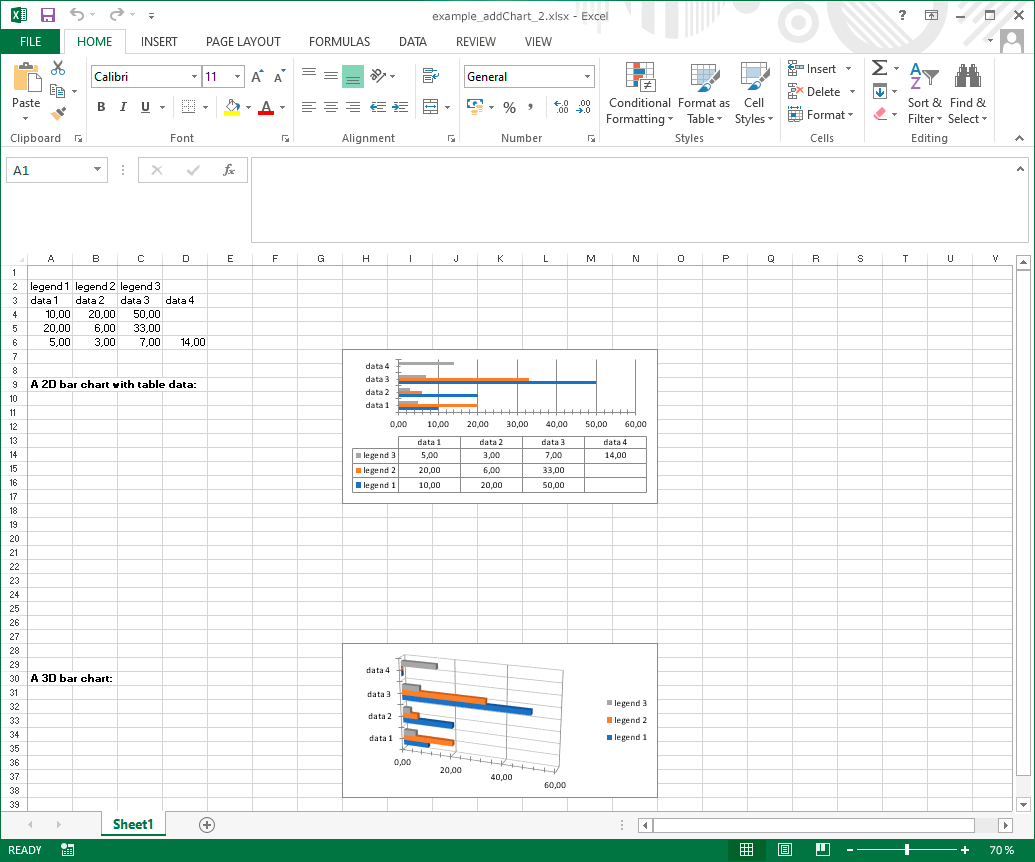
Example #2
The resulting XLSX looks like:
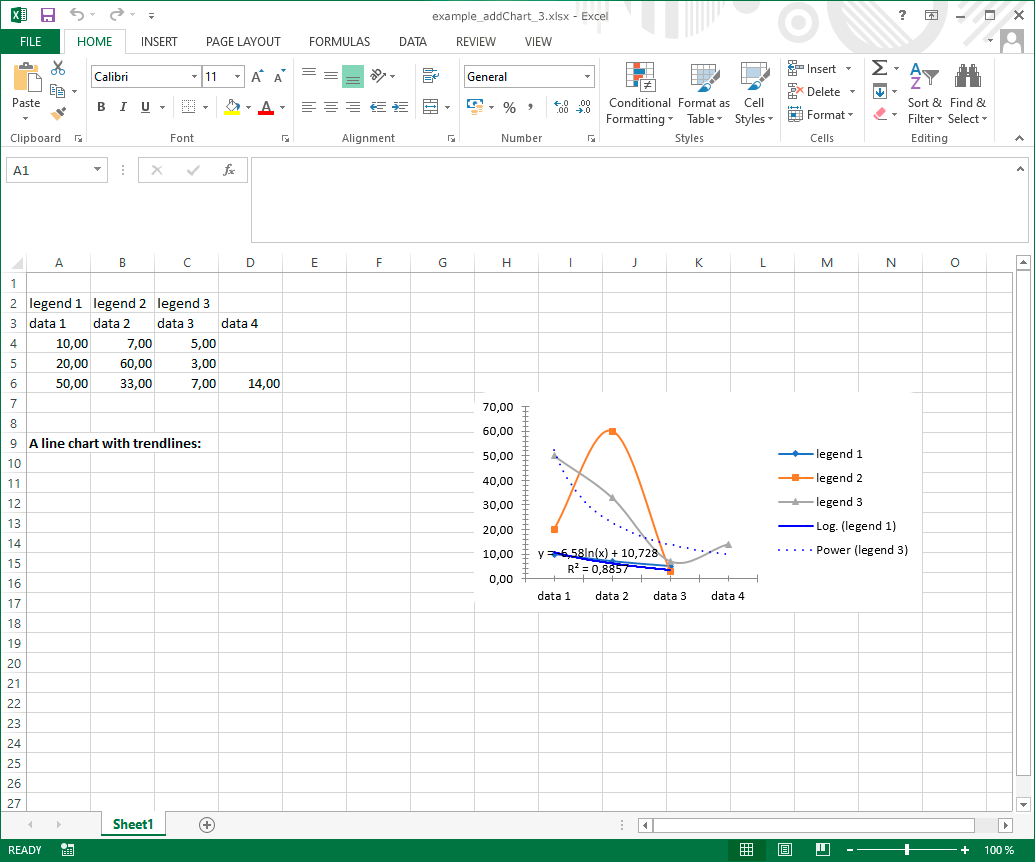
Example #3
The resulting XLSX looks like:
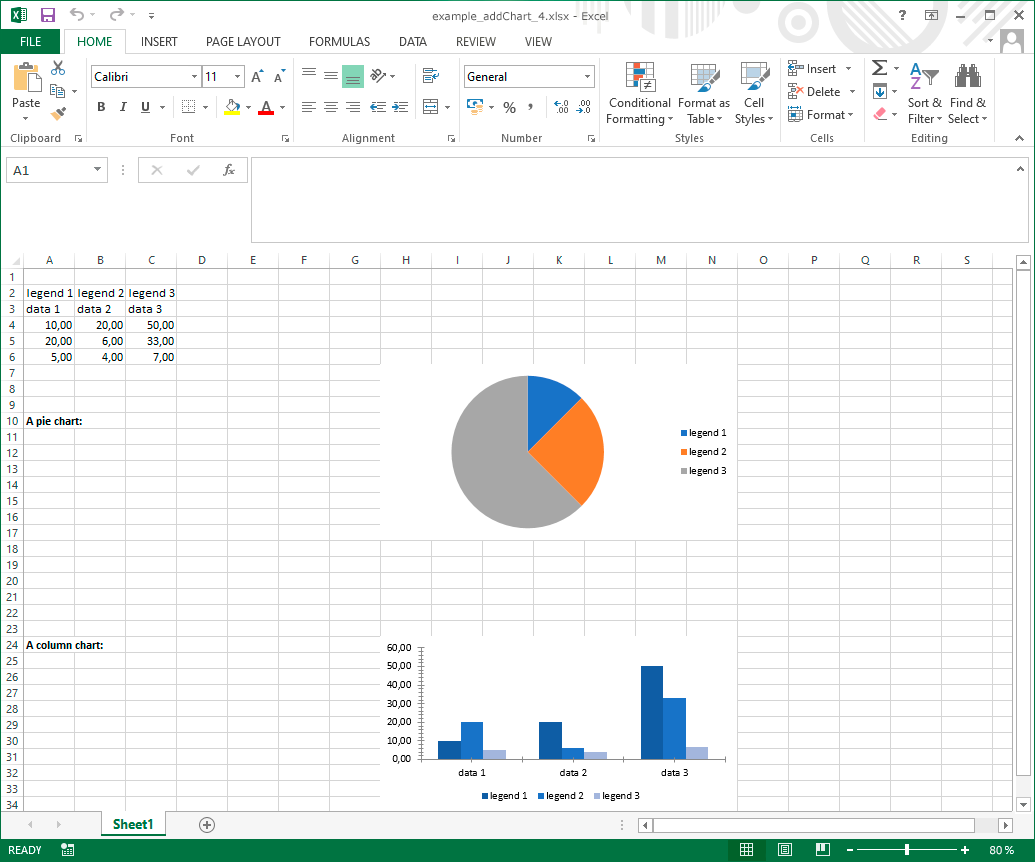
Example #4
The resulting XLSX looks like:
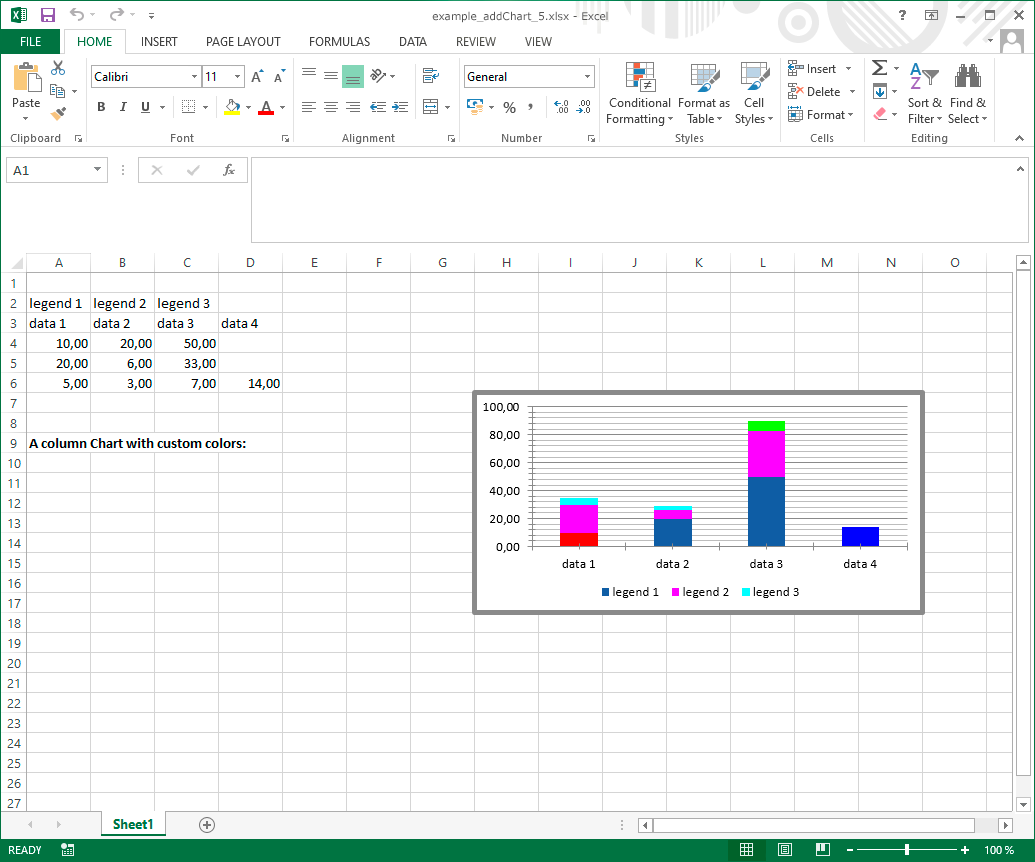
Example #5
The resulting XLSX looks like:
- phpxlsx 4.5:
- set custom title layout.
- apply font styles to series and values labels.
- valueDataLabels option.
- phpxlsx 4.0:
- ofPie chart type.
- apply custom colors to lines.
- phpxlsx 3.5:
- bubble and scatter chart types.
- phpxlsx 3.0:
- radar and surface chart types.
- phpxlsx 2.0:
- bar3DCylinder, bar3DCone, bar3DPyramid, col3DCylinder, col3DCone, col3DPyramid, area and area3D chart types.
- phpxlsx 1.0:
- new method.